Retail Property Manager - Unit 4 Chinese Food Restaurant
Sub-meter 20923 (SimpleSub) | Data: July 23 - October 21, 2026 | Prepared October 21, 2026
EXECUTIVE SUMMARY
Sub-metering at the property began on July 23, 2026. Within weeks, it showed that the kitchen meter at Unit 4 never really stopped: water flowed every hour of the day and night, including roughly 35 gallons per hour while the restaurant was closed. After repeated automated leak alerts reached the Property Manager and were passed to the tenant, the tenant reviewed the hourly data, identified an older water-cooled walk-in cooler as the likely cause, and replaced it with an air-cooled unit.
RESULTS
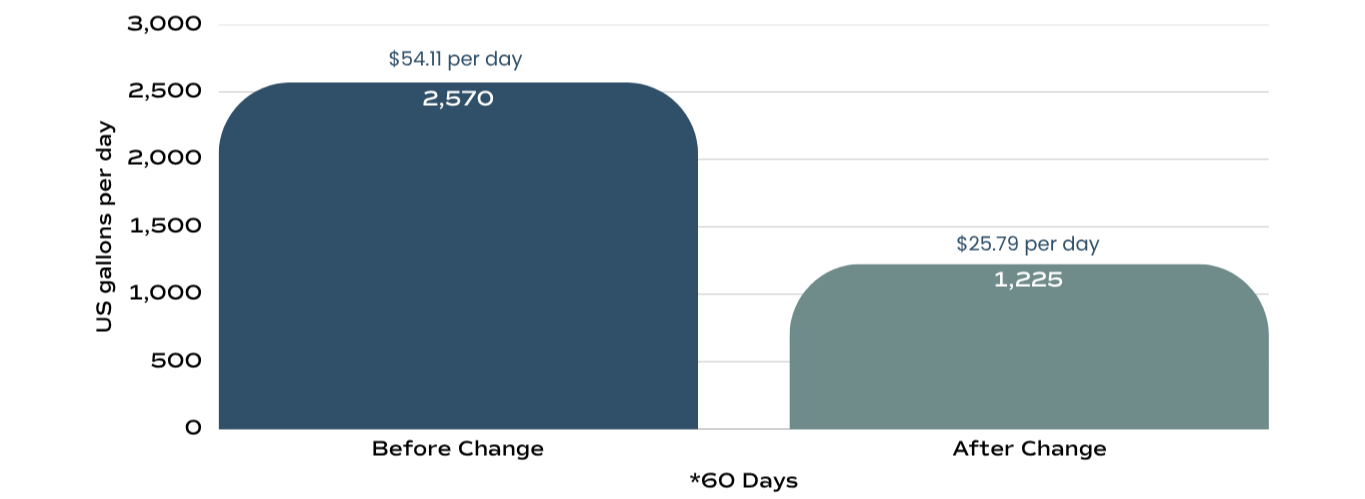
Average daily consumption fell from 2,570 to 1,225 US gallons (a 52% reduction), overnight flow dropped to zero, and the tenant's water cost fell from about $54.11 to $25.79 per day at York Region rates, roughly $10,337 per year at the current run rate.
Total consumption for the full data period was 191,681 gallons (725.6 m³), an estimated $4,035.73 at the York Region 2026 rate of $5.5620/m³.
THE STORY:
Alert, Action, Response, Result
The sequence below combines the meter data with the email record between the Property Manager, the tenant and Bondi.
| DATE | EVENT | WHO |
|---|---|---|
| July 2023 | SimpleSub sub-metering goes live; hourly readings begin on the kitchen meter. | Bondi / Property Manager |
| Jul 24 - Sep 14 | Water runs every hour of every day. Overnight flow holds at about 30-40 gal/hr; many days show a full 24 hours of continuous flow. | Meter Data |
| Sept 15, 12 PM | Leak alert threshold met: 1.0 gallon or more used every hour for 24 hours. Automated alert emailed to the Property Manager (a repeat notice). | Alert system |
| Sept 15, 3:17 PM | Property Manager forwards the high-usage notice to the tenant. | Property Manager |
| Sept 15, 5:07 PM | Tenant responds with curiosity: suspects the water cooled cooler compressor and asks which meter is theirs. Property Manager asks Bondi whether this could explain the higher usage. | Tenant / Property Manager |
| Sept 18, 7:31 AM | Bondi replies: older water-cooled equipment is a likely source of continuous flow. Shares hourly graphs, a one day detail chart and a two-meter comparison, and confirms the kitchen (east) meter carries the steady overnight load of 15-30 gal/hr. | Bondi |
| Sept 18 | Property Manager thanks Bondi for the information and the data is shared with the tenant. | Property Manager |
| Sept 22, ~9 PM | Meter data shows continuous flow stops for the first time. This is the point the water-cooled unit was taken out of service (exact install date not recorded; inferred from the meter). | Tenant |
| Sept 23 Onwards | Overnight flow is 0 gal/hr every night. Daily use settles near 1,225 gallons. | Meter Data |
CONSUMPTION OVERVIEW
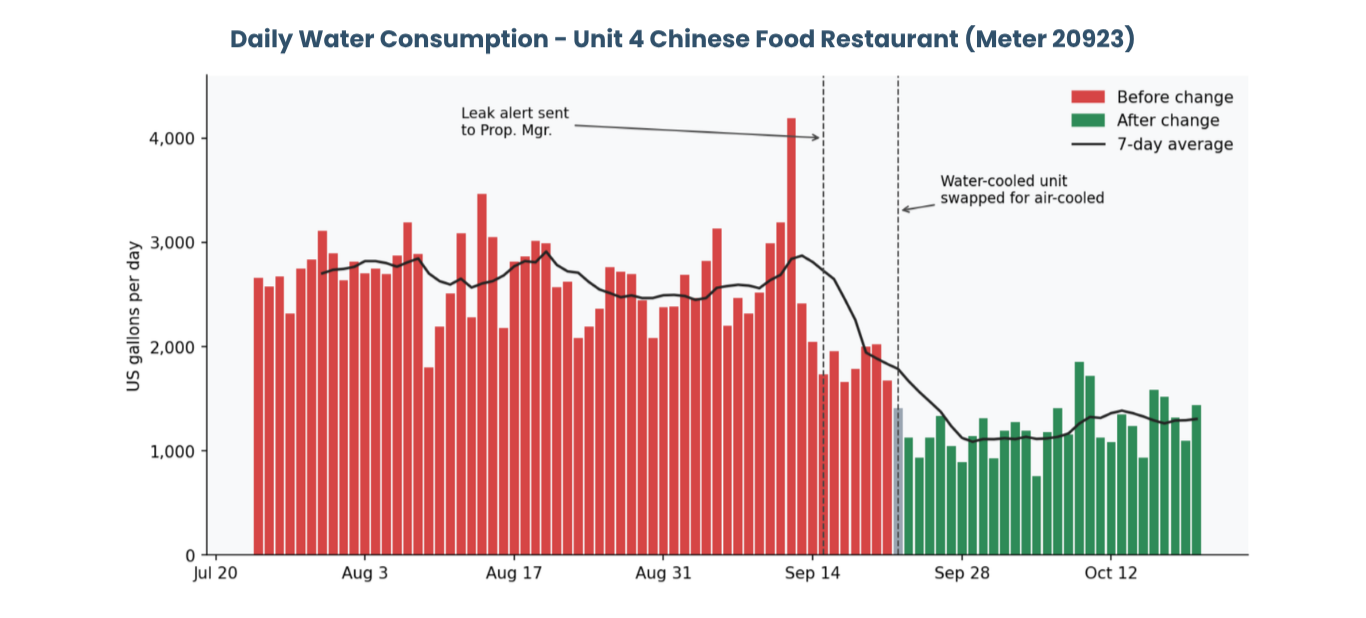
The chart separates the 60 full days before the change (red), the transition day of September 22 (grey) and the 28 full days after (green). October 21 is excluded because the day is not yet complete (last reading 12:00).
| METRIC | BEFORE CHANGE | AFTER CHANGE |
|---|---|---|
| Days Analyzed | 60 | 28 |
| Average / Day | 2,750 gal | 1,225 gal |
| Median / Day | 2,632 gal | 1,186 gal |
| Highest Day | 4,193 gal | 1,186 gal | Lowest Day | 1,659 gal | 759 gal |
| Total Volume | 583.7 m3 | 129.8 m3 |
OVERNIGHT FLOW:
The Signature of the Problem
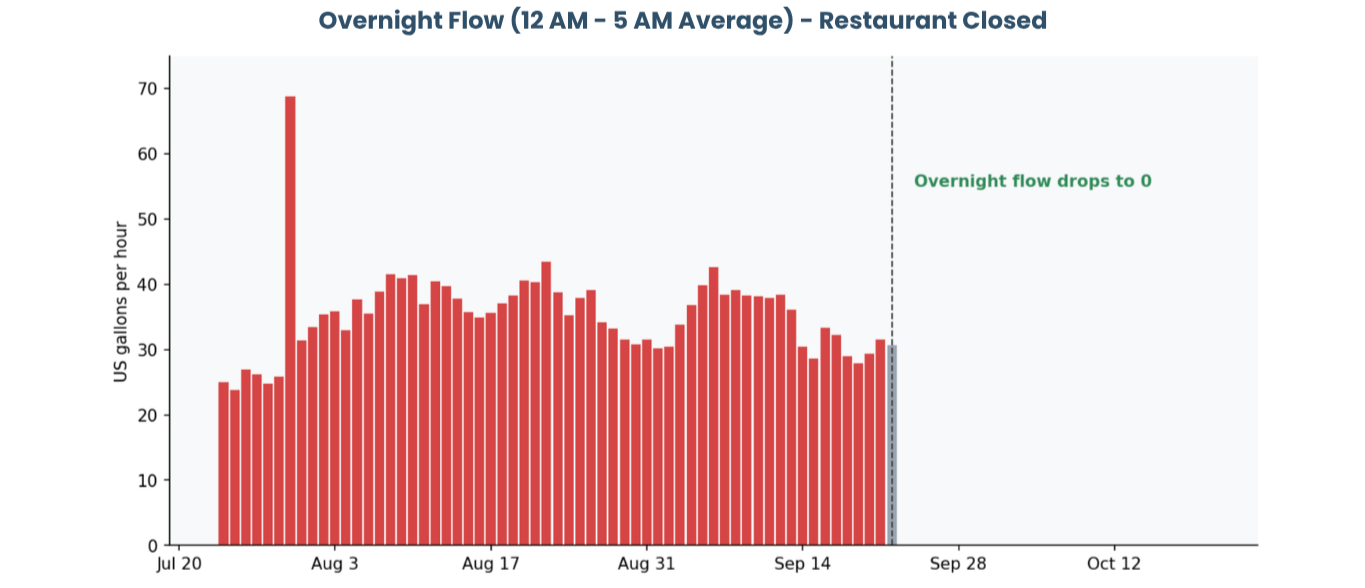
Before the change, the overnight average (12 AM - 5 AM) was 35.4 gallons per hour, roughly 2.2 L/min, running whether or not the restaurant was open. On 40 of the 60 days before the change, flow registered in every one of the 24 hours. After the change, 0 days show continuous flow and the overnight average is 0.0 gal/hr. Flow now follows the restaurant's operating hours, starting around 11 AM and ending around 9 PM.
USAGE PATTERN ANALYSIS
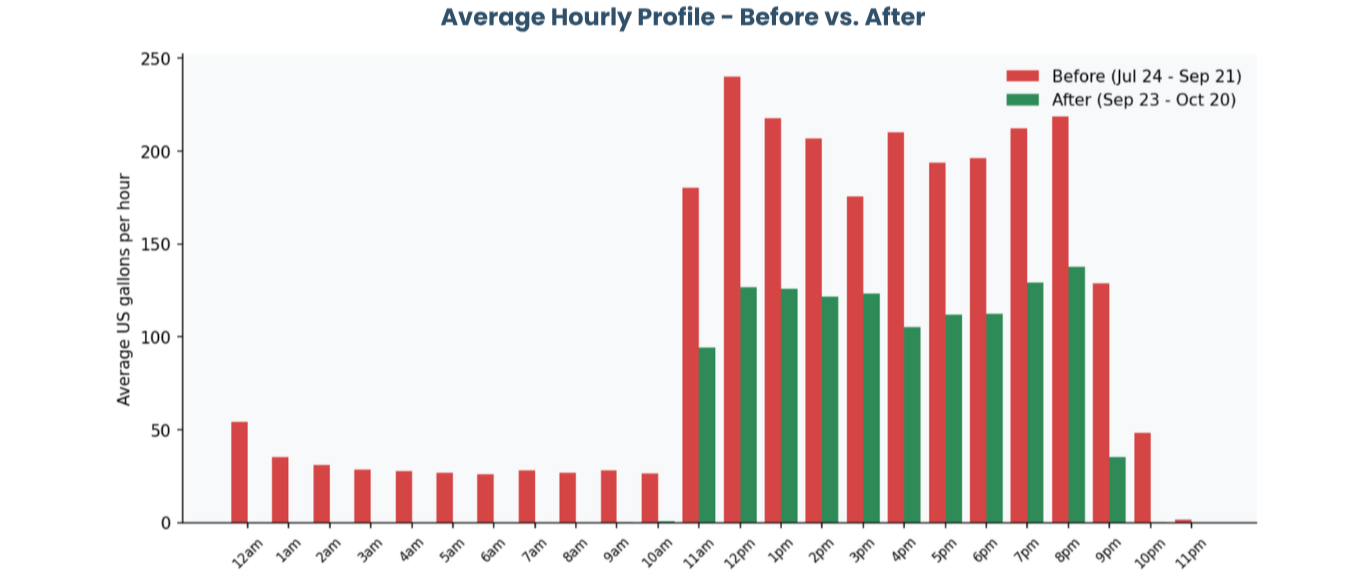
Two things changed. The overnight and early-morning baseline disappeared entirely, and the business-hours peak fell from about 180-240 gallons per hour to about 95-140. The second change is consistent with a water-cooled condenser drawing more water as the cooling load rises; an air-cooled unit rejects heat to the air instead.
PEAK USAGE EVENTS
| DATE | VOLUME (gal) | EST. COST |
|---|---|---|
| Sat, Sept 12, 2026 | 4,193 | $88.27 |
| Fri, Aug 14, 2026 | 3,467 | $73.00 |
| Fri, Aug 7, 2026 | 3,192 | $67.61 |
| Fri, Sept 11, 2026 | 3,191 | $67.19 |
| Sat, Sept 5, 2026 | 3,129 | $65.88 |
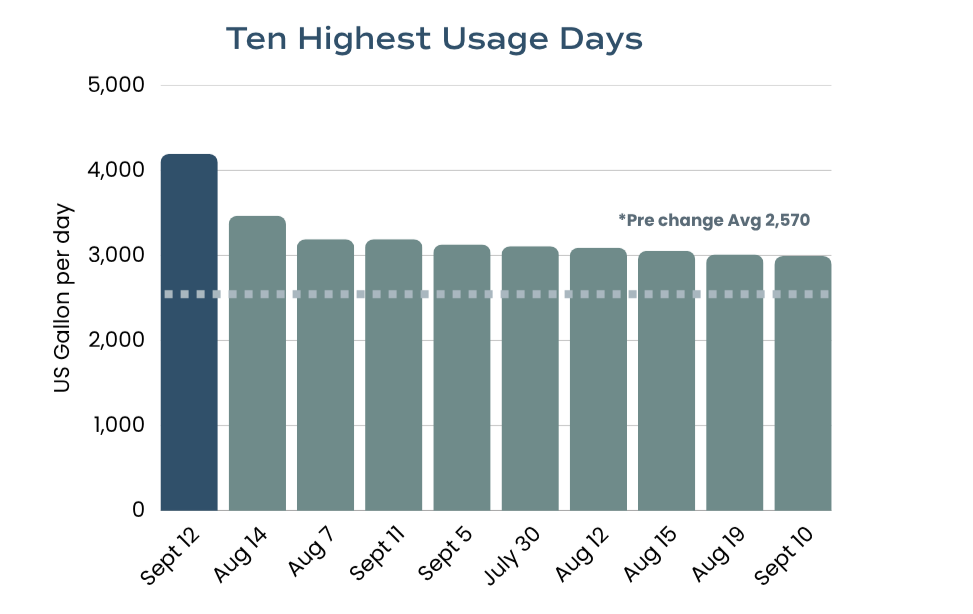
All of the ten highest days fall in the "before" period; none of the post-change days appear. The single highest day, Saturday September 12, reached 4,193 gallons.
BEFORE VS. AFTER
FINANCIAL IMPACT ANALYSIS
| METRIC | VALUE |
|---|---|
| Municipality | York Region |
| Rate Applied (2026, water + wastewater) | $5.5620 / m3 |
| Total Consumption (Jul 23 - Oct 21) | 725.6 m3 (191,681 gal) |
| Total Estimated Cost (full period) | $4,035.73 |
| Average Daily Cost - Before Change | $54.11 / day |
| Average Daily Cost - After Change | $25.79 / day |
| Reduction in Daily Cost | $28.32 / day (52%) |
| Annualized Cost - Before Change | $19,749 / yr |
| Annualized Cost - After Change | $9,412 / yr |
| Estimated Annual Savings (total reduction) | $10,337 / yr |
| Of which: closed-hours flow eliminated (12 AM - 11 AM) | $7.14 / day ($2,608 / yr) |
Costs are estimates based on wholesale municipal bulk water rates and do not include applicable taxes, distribution charges, or property-specific surcharges.
How to read the savings figures: The $10,337 figure annualizes the full before/after difference. The $2,608 figure is the narrower, more certain piece: water that ran through the closed hours and no longer does. The reduction in business-hours use is also visible in the data but may include some seasonal and trading variation, so the true annual saving is likely to sit between the two.
Notes & Methodology
• Source: SimpleSub hourly usage export for meter 20923 (Jul 23 - Oct 21, 2026, US gallons, hourly, US/Eastern). 2,184 readings; no missing or negative values.
• This data covers the kitchen meter only. Totals are combined for the single meter.
• Before = Jul 24 - Sep 21 (60 full days). After = Sep 23 - Oct 20 (28 full days). Jul 23 (partial first day), Sep 22 (transition day) and Oct 21 (incomplete) are excluded from averages but included in the full-period total.
• The equipment change date is inferred from the meter, where continuous flow stops after about 9 PM on September 22. It should be confirmed with the tenant if an install date is needed for publication.
• Usage was already easing before the change: the average was 2,679 gal/day through Sep 13 and 1,809 gal/day from Sep 14 to Sep 22. The data does not show what caused that interim dip.
• The after-change period is shorter than the before-change period and falls in cooler weather, so savings from the equipment alone should be re-checked after a longer post change window.
• Cost conversion: 1 US gallon = 3.78541 L; York Region 2026 combined water and wastewater rate $5.5620/m³.