

CASE STUDIES
SayaLife Case Study
Catching a Leak Before It Becomes a Bill
Details:
Real-time detection of a runaway fixture leak — Math Tutoring Business tenant unit.
Site Profile:
Tenant: Math Tutoring Business.
Fixtures: two 2-piece washrooms and one common-area sink, served by a 3/4" supply line.
A SayaLife smart meter/valve is installed on the supply, providing live flow-rate monitoring and remote shutoff capability.
Billing basis: York Region combined water & sewer rate of $5.40/m³.
The Event: A Fixture That Never Shut Off
Starting at midnight on July 29, the day chart below shows sustained flow of roughly 3.3–3.6 L/min with no overnight pause — the signature of a fixture (most likely a toilet fill valve) that continuously runs rather than shutting off after use. By approximately 7:30 AM, cumulative consumption for the day had already reached 1,831 L, over 60 times this tenant's typical daily draw.
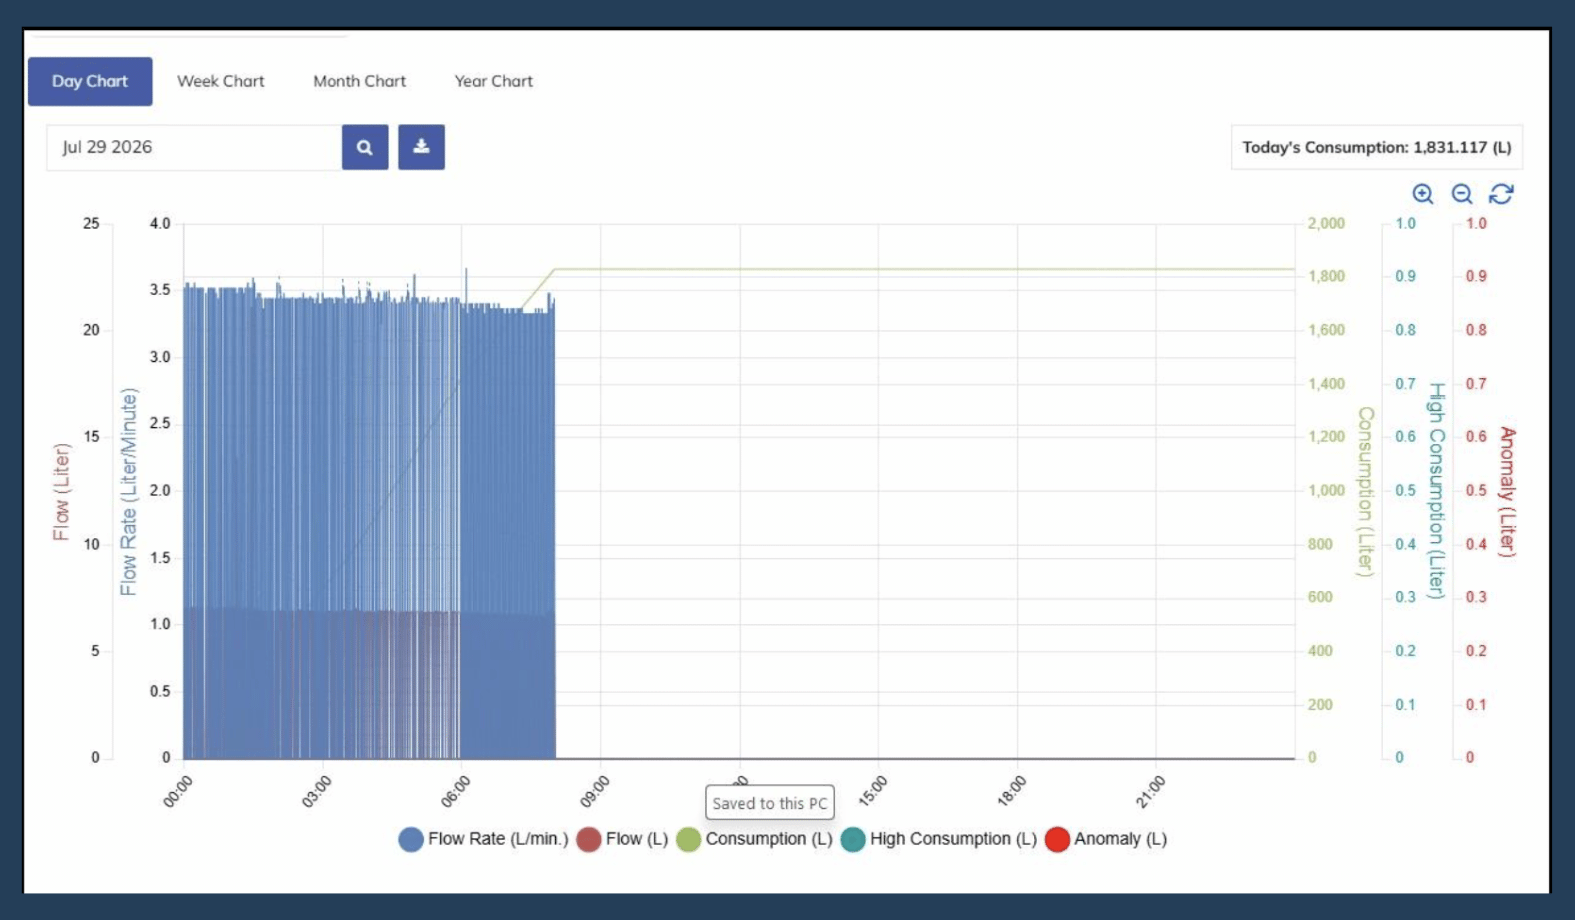
Figure 1 — Day chart, July 29, 2026: continuous flow rate with no shutoff periods
The Monthly Pattern Confirms the Anomaly
Daily consumption ran 0–58 L/day for nearly all of July — consistent with normal tutoring-business hours and occasional closures. On July 28, usage jumped to 766.6 L; on July 29 (partial day at time of reading), it reached 1,851.8 L. The break from baseline is immediate and unmistakable.
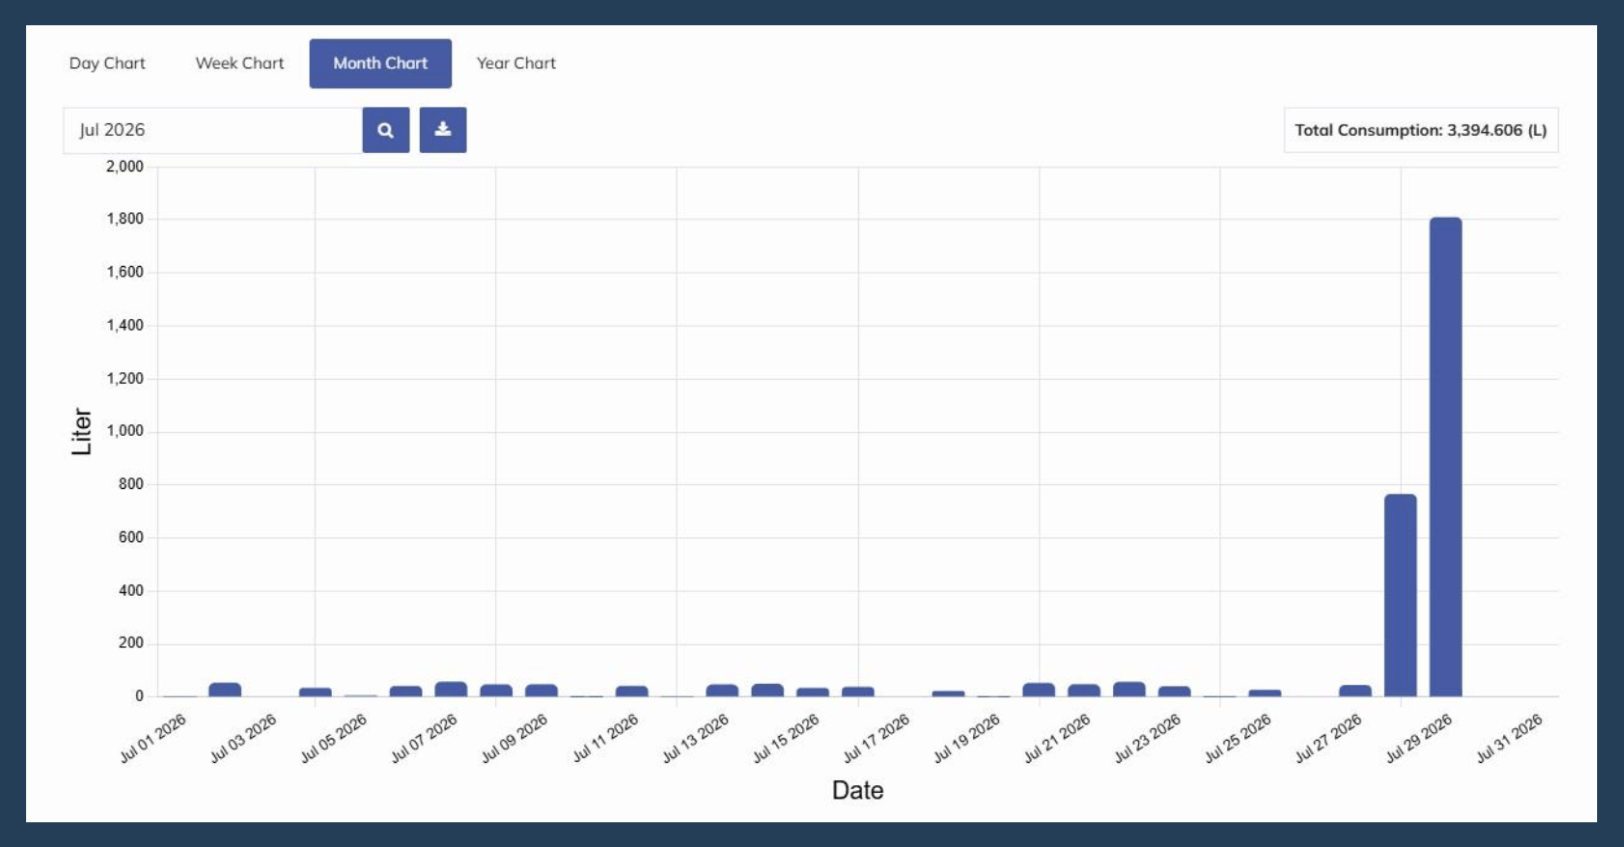
Figure 2 — Month chart, July 2026: two-day spike against a stable baseline
Cost of Loss to Date
Baseline is the tenant's 27-day average daily consumption for July 1–27 (30.3 L/day), prior to the event.
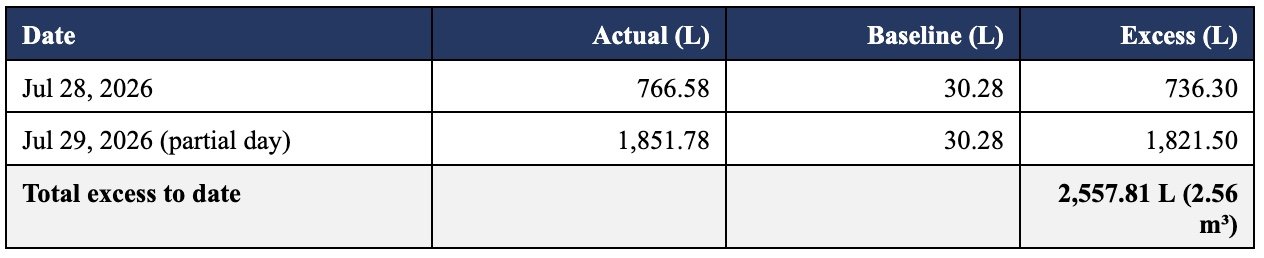
2.56 m³ excess × $5.40/m³ = $13.81 in water & sewer cost lost in the first two days alone.
That figure looks small only because the leak is two days old. At the current sustained rate (~1.8 m³/day of excess flow), the cost compounds quickly if the fixture is not isolated:

Why Early Detection Matter
Because the SayaLife device on this line is a meter and valve, the event was visible the same day it started — not buried in a bill 30-60 days later. That window is what turns a runaway leak into a same-day fix instead of a four-figure surprise.
Recommended next step: isolate the fixture (inspect both 2-pc washrooms and the common sink for a running fill valve), repair, and confirm flow returns to baseline before restoring full supply.
LEAK DETECTION CASE STUDY
146 Lakeshore Road West, Oakville – Unit 2A – Easy Financial
Property Details:
• Property Type: Commercial retail – financial lending office
• Monitoring: SimpleSub Sensor, 1" DCW line
• Issue Detected: Continuous-running toilet
• Alert Lag: 1 day (next-day alert)
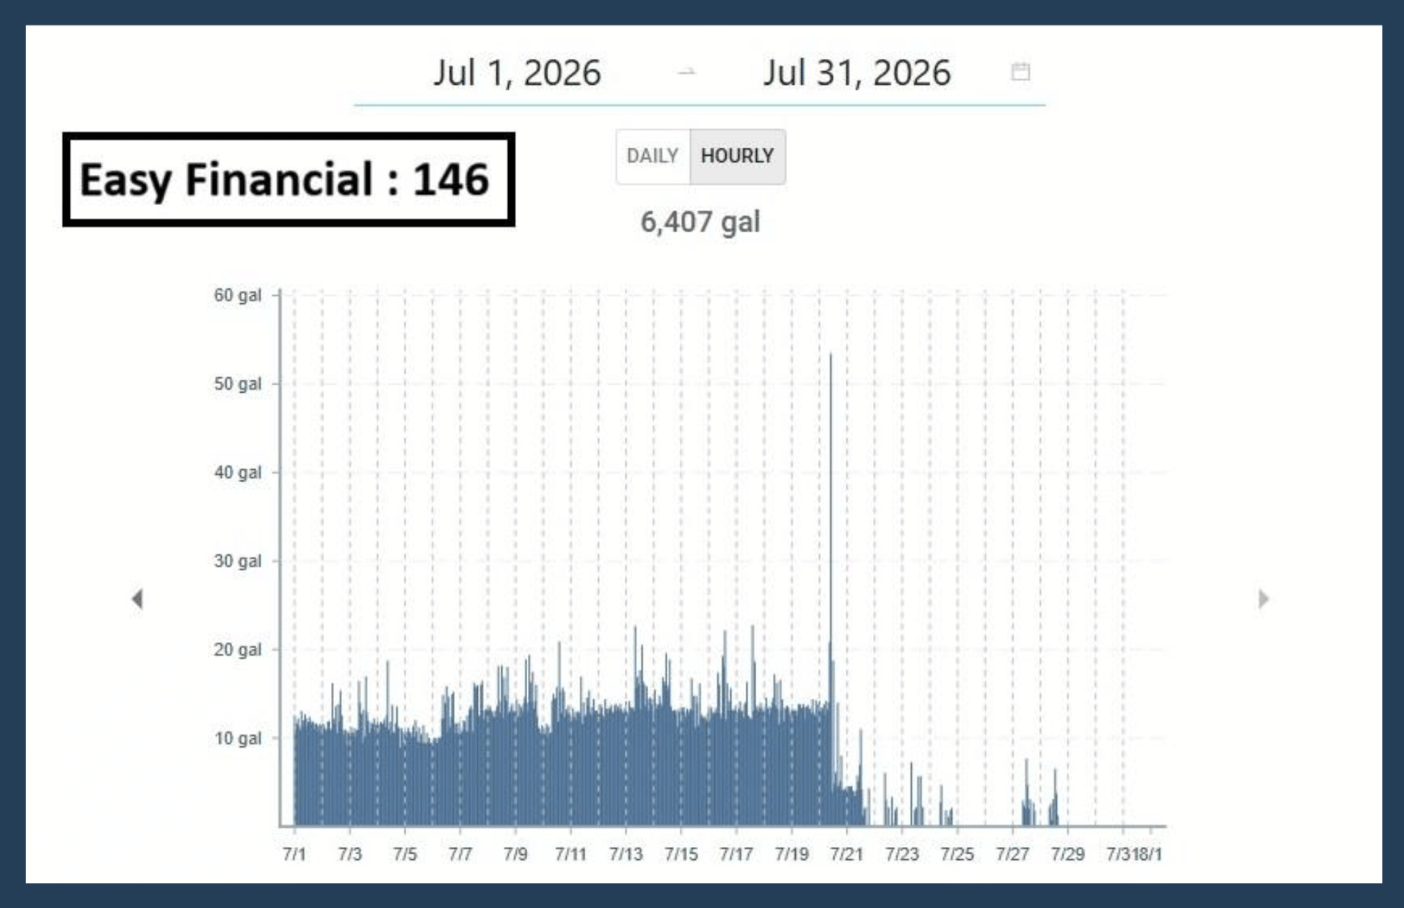
Hourly & Daily Consumption – July 2026
Background:
The subject unit is a commercial retail space occupied by Easy Financial, a financial lending operation, with a 2-piece washroom and staff kitchen sink serving the front-end office and customer reception area. A SimpleSub sensor was installed on June 30, 2026 on the 1" domestic cold water line, ahead of the existing sub-meter. Within 24 hours – on July 1, 2026 – the sensor generated a leak alert.
The property manager was notified immediately. To help confirm the finding, a usage comparison was provided from another location occupied by the same tenant, showing what a normal consumption profile looks like for this type of unit. The comparison made clear that the flow pattern at 146 Lakeshore was abnormal: water was running continuously, 24 hours a day, including overnight hours when the office is closed and no fixtures should be in use.
Investigation confirmed the cause: a running toilet in the 2-piece washroom.
Source: SimpleSub Sensor – hourly consumption, Unit 2A, July 1–31, 2026
Consumption & Financial Impact
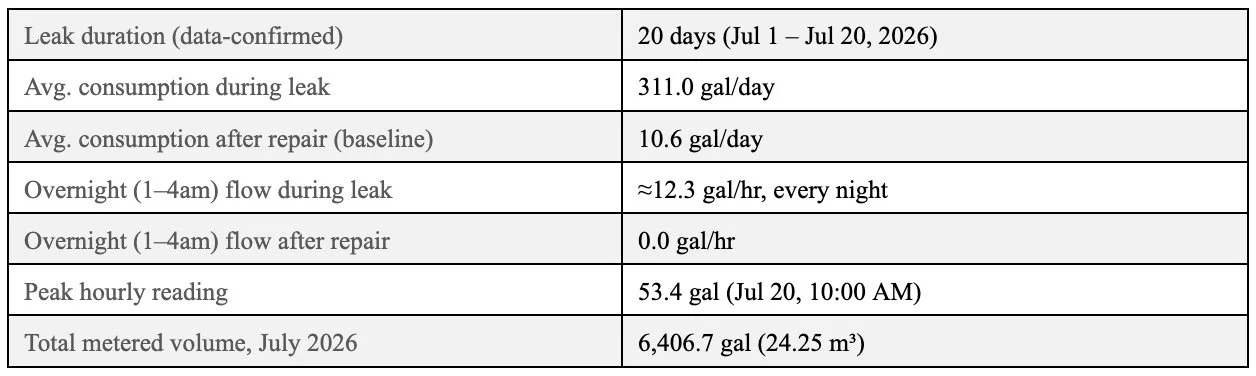
Key Metrics:
Financial Impact of Loss:
Excess consumption is calculated as the difference between average daily usage during the 20-day leak window and the confirmed post-repair baseline, applied at the Halton Region combined water/wastewater rate of $3.50/m³.
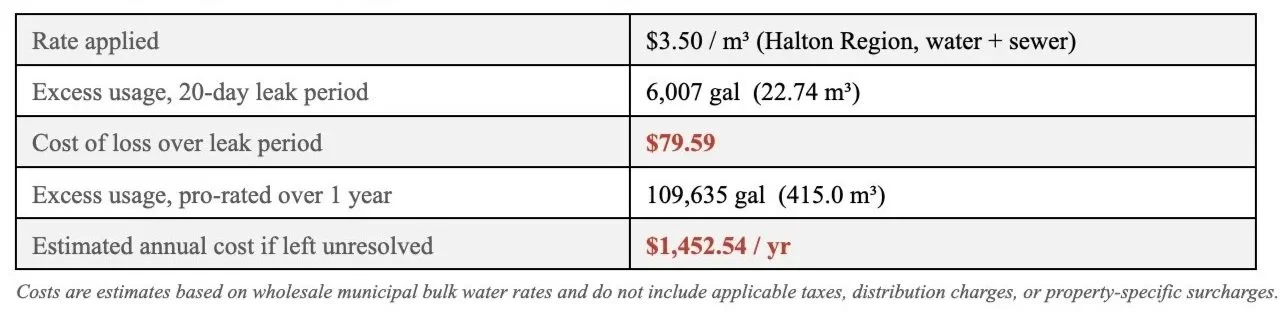
Outcome:
Early detection limited the leak to a 20-day window rather than an indefinite, unmonitored run. Had the running toilet gone undetected – as it would have without sub-metering – it was on pace to waste roughly 415 m³ and cost approximately $1,452.54 per year in water and sewer charges alone, before accounting for any risk of water damage from a continuously running fixture.
The SimpleSub alert, generated the day after installation, enabled the property manager to identify and repair the issue within days, converting an open-ended loss into a bounded, quantifiable, and quickly-resolved event.
WATER RENEWAL PROJECT
Edmonton Project
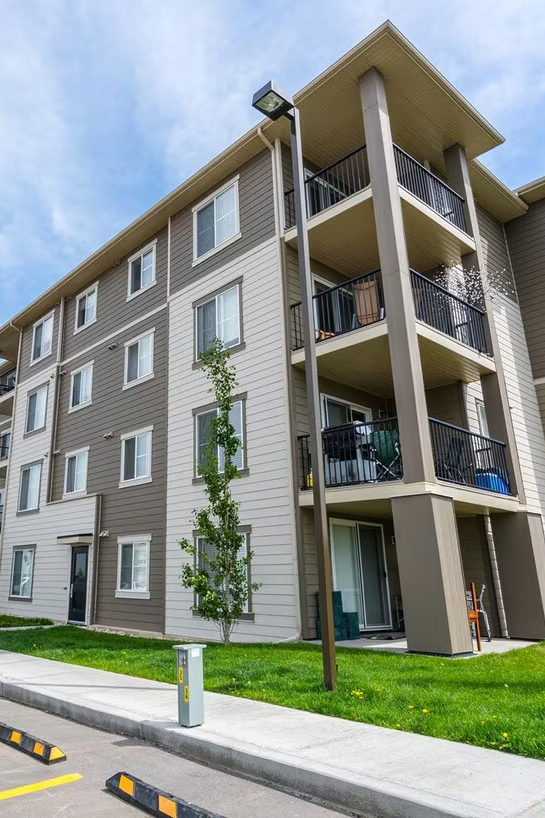
Property Details
• Total Units: 75
• Building Height: 4 Stories
Daily Water Volume Reduction: 39%
Annual Savings: $22,627
75 Guard Dog Valves TM Installed
BEFORE BONDI WATER:
Base Case: Pre-Retrofit Usage
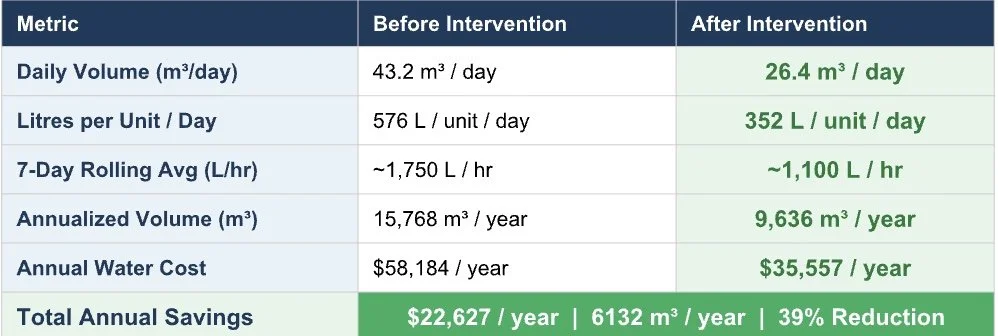
• Daily Water Use: 43,200 litres / 11,412 gallons (576 L or 152 gallons per unit/day)
• Annualized Volume: 15,768,000 litres/Year
• Annualized Cost: $58,184/Year
AFTER BONDI WATER:
Post-Retrofit Results
• Daily Water Use: 26,400 litres / 6,974 gallons (352 L or 93 gallons per unit/day)
• Daily Water Volume Reduction: 39%
• Leak Rate Post-Retrofit: 0%
• Annualized Volume: 9,636,000 litres/Year
• Annual Water Cost: $35,557/Year
• Total Annual Savings: $22,627
• Measurement & Validation: Pre- and post-retrofit monitoring conducted using Flowie sensors from Alert Labs on the city water meter
Before & After — Key Metrics
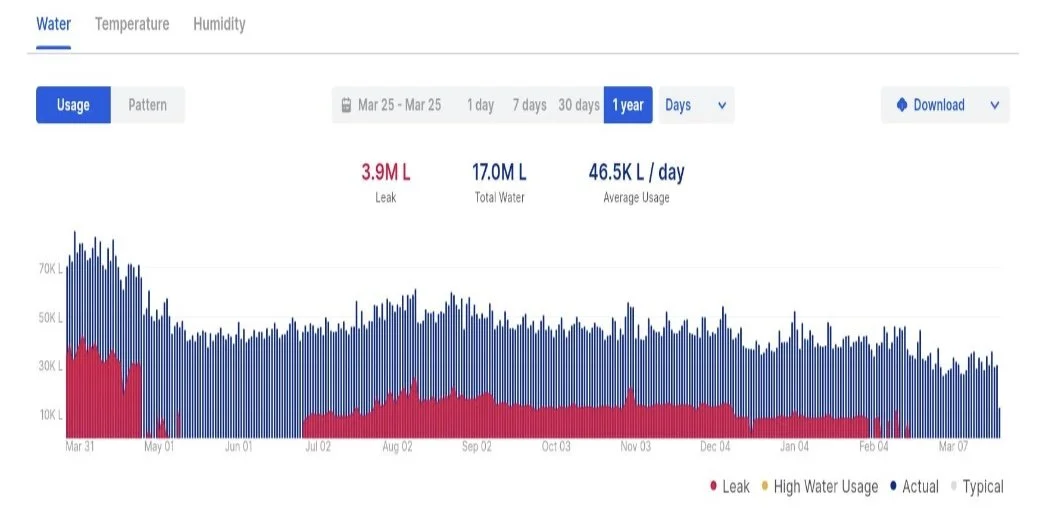
WATER RENEWAL PROJECT
Property Details
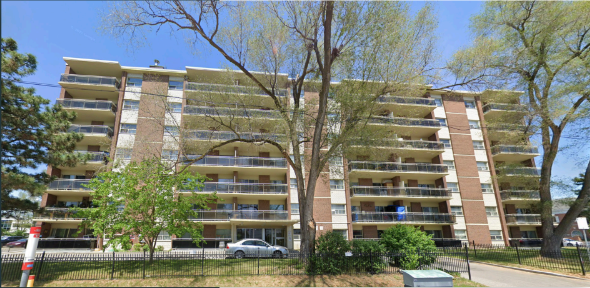
• Building Height: 14 stories
• Total Units: 94 (predominantly one-bedroom)
• Year Built: 1970
540 Sherbourne St.
Simple Payback Period: Under 1 year
Daily Water Volume Reduction: 46%
NOI Increase: $35,000
BEFORE BONDI WATER:
Base Case: Pre-Retrofit Usage
• Daily Water Use: 52,000 liters / 13,735 gallons (553 L or 146 gallons per unit/day)
• Toilet Types: Mix of 4.8 liter and 6.0 liter per flush toilets
• Leak Rate: 23% (22 out of 96 toilets) leaking at time of installation
AFTER BONDI WATER:
Post-Retrofit Results
• Daily Water Use: 28,400 liters / 7,501 gallons (301 L or 80 gallons per unit/day)
• Daily Water Volume Reduction: 46%
• Leak Rate Post-Retrofit: 0%
• Measurement & Validation: Pre- and post-retrofit monitoring conducted using Flowie sensors from Alert Labs on the city water meter

Scope of Work
• Inspect and repair or replace toilet fill valves
• Replace existing toilet flappers with Korky Floater Flappers
• Install Guard Dog ValvesTM – motion-activated flow control valves on toilet supply lines to eliminate ongoing leak risk
• Test and replace inefficient showerheads and faucet aerators with high-efficiency model
Financial Summary
• Total Project Cost: $34,000 after taxes
• Year One Savings: $35,000
• Net Operating Income Increase: $35,000
• Property Valuation Increase: $700,000
(based on 5% CAP rate)
• Simple Payback Period: Less than 1 year

Performance Outcomes

6210 Yonge Street
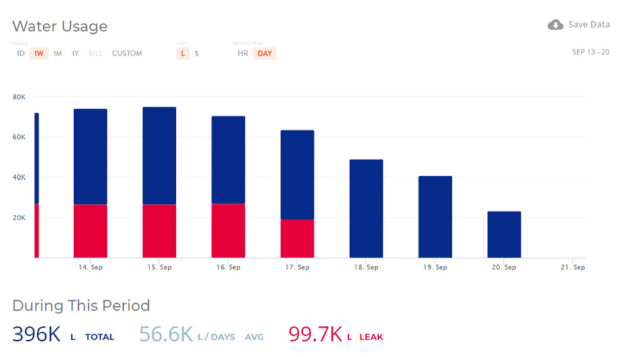
After one week of water savings measures
Annualized - $54,136.00
7-month payback
BEFORE BONDI WATER:
Building-wide leak rate exceeding 44%
Overnight volume over 2,000 litres per unit per hour
Monthly cost before water measures implemented = $134 per unit
AFTER BONDI WATER:
Leak rate eliminated to 0%
Overnight volume reduced to 275 - 300 litres per unit per hour
Monthly cost after water measure implemented = $65 per unit
Increase in Asset Value:
$1,353,000 (based on 4% cap rate)
Reduction:
Pre-installation: 77 m3 / day = 927 L / Unit / Day
Post-installation: 40 m3 / day = 481 L / Unit / Day
48% Reduction
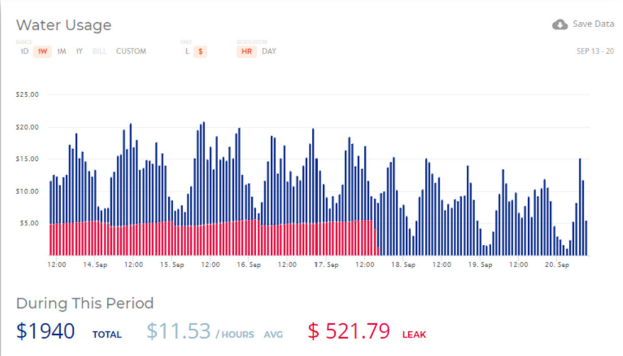

Water Cost Trending:
Scope:
Inspect bathroom fixtures (shower, tub faucet, toilet, bath faucet)
Flow test GPM on shower and bath faucets. Replace where > 2.0 GPM
Denote deficiencies where fixtures are leaking, cartridges need replaced and/or where tub diverter is not working properly
Install Guard Dog Valve on toilet supply line
Install Piggy Back Valve and/or R-19 Valve on non-functional supply shut-offs
Engage partition valves for shut off where toilet shut off inoperable
Install and Adjust OEM American Standard Flapper to optimize flush volume
Replace fill valve
Flush and test for flush volume and/or leaks
2 Armel Court, Toronto, ON
18 Story - 1970’s High Rise | 253 Unit Building | 275 Toilet Count

20% Water Saved Annually
$68,000 Saved Annually
BEFORE BONDI WATER:
Overnight volume ranging from 3,500 - 4,000 L / Hour
No controls or capability to target and limit loss from running toilets
Fill valve issues and worn flush seals contributing to running / leaking toilets
Behaviour of tenants such that leaking toilets went un-reported
AFTER BONDI WATER:
Overnight volume dropped to 1,700 L / hour with motion-activated flow control from Guard Dog Valve
Hourly volume dropped by 50%
Impact of Tenant Behaviour negated with motion sensing control valve
Toilet Inventory:
Primarily consists of 3.0L / 0.8 G Toilets with vacuum assist flush mechanism flush and standard Fluidmaster Fill valves.
Historical and Post Installation Metrics:
For the month immediately prior to installation, the average volume at 3 am in the subject property was 3,166 L or 12.51 L / Unit / Hour.
The installation project was completed over two separate time periods: April 9th - 12th and April 26th
The measured volume for May 1st - May 13th is 2,191 L / H or 8.65 L / Unit / Hour
The table pictured captures the 3 am Volume from March 1st 2024 to May 13th 2024.
The projected savings on an annualized basis is 8,535 m3 which at current rates equates to $38,500.
The total project cost ws $66,000 pointing to a simple payback of 1.7 years (assuming no water / sewer rate increase in 2025).
Overnight Volume Trajectory

3071 Perry Avenue, Bronx, NY
12 units

34.2% Water Saved Annually
$6,500 Saved Annually
BEFORE BONDI WATER:
No controls or regulation of flow for showers, aerators and toilets
Older fixtures contributing to inefficient water usage
AFTER BONDI WATER:
In-suite efficiency upgrades to reach EPA standard flow rate
Installation of the Toilet Scrooge™ valve to eliminate leaks from running toilets.
Historical Metrics:
The starting point for this building was annual sewer and water costs of $19,008.2023.
Average consumption: 289 Gallons / Unit / Day
February - April 2024 Average consumption: 190 Gallons / Unit / Day - 34.2% savings.
This installation led to a steady decline in the average daily consumption volume.
Return on Investment:
The net benefit of the Water Scrooge™ conservation program is annual savings of approximately $6,500.
This is calculated using:
The initial average usage of 3,471 Gallons / Day (2023 Consumption)
The revised average usage of 2,286 Gallons / Day (2024)
Water and Sewer Cost of $0.015 / Gallon
Hot water savings of $59.25 daily
The payback period on the $5,400 investment is over ten months, with an ROI of 116%
Return on Investment over 10 years:

80 Mornelle Court, Toronto, ON
265 units

32% Water Saved Annually
$86,000 Saved Annually
BEFORE BONDI WATER:
No monitoring on main water supply to isolate variances and spikes in usage
No ability to address loss from running / leaking toilets
Double-digit growth in water expense year over year
AFTER BONDI WATER:
Decrease water expense in the building through (A) efficiency/conservation measures and (B) minimizing water loss
due to leaks.Install flow valve sensors on toilet supply lines (Guard Dog Valve(™)
Historical Metrics:
Annual Sewer and Water Costs in excess of $350,000 or $1,300 / unit
Day 1 Consumption was 246 m3 / day
Full Calendar Year after Water Renewal Daily Consumption 181 m3 / day
Return on Investment:
The net benefit of this Shared Savings Water Program (highlighted by the deployment of the Guard Dog Valve on the toilets) is a net reduction of 20% against a Baseline of 222 m3 / day.
Using our Shared Savings Model, the customer is enjoying net savings of $35,000 / year with no capital or operating expense.
The uplift in property value is approximately $800,000 with no money out of pocket and the piece of mind that a capable third party is motivated to continue to monitor, manage and control water expenses.
Daily consumption Feb 16th - Feb 27th
