
550 Suites Now Use 152 Fewer Litres Each, Every Day
Rosedale East is two 275-unit buildings. After a full retrofit of toilets, shower heads and aerators, combined use is 143 m³ a day against a 227 m³ baseline, a 36.9% reduction. Bondi funded the entire installation.
RESULTS
$406.59 saved per day at $4.86/m³
$153,970 projected savings in 2027
36.9% reduction vs. baseline
83.7 m³ saved per day
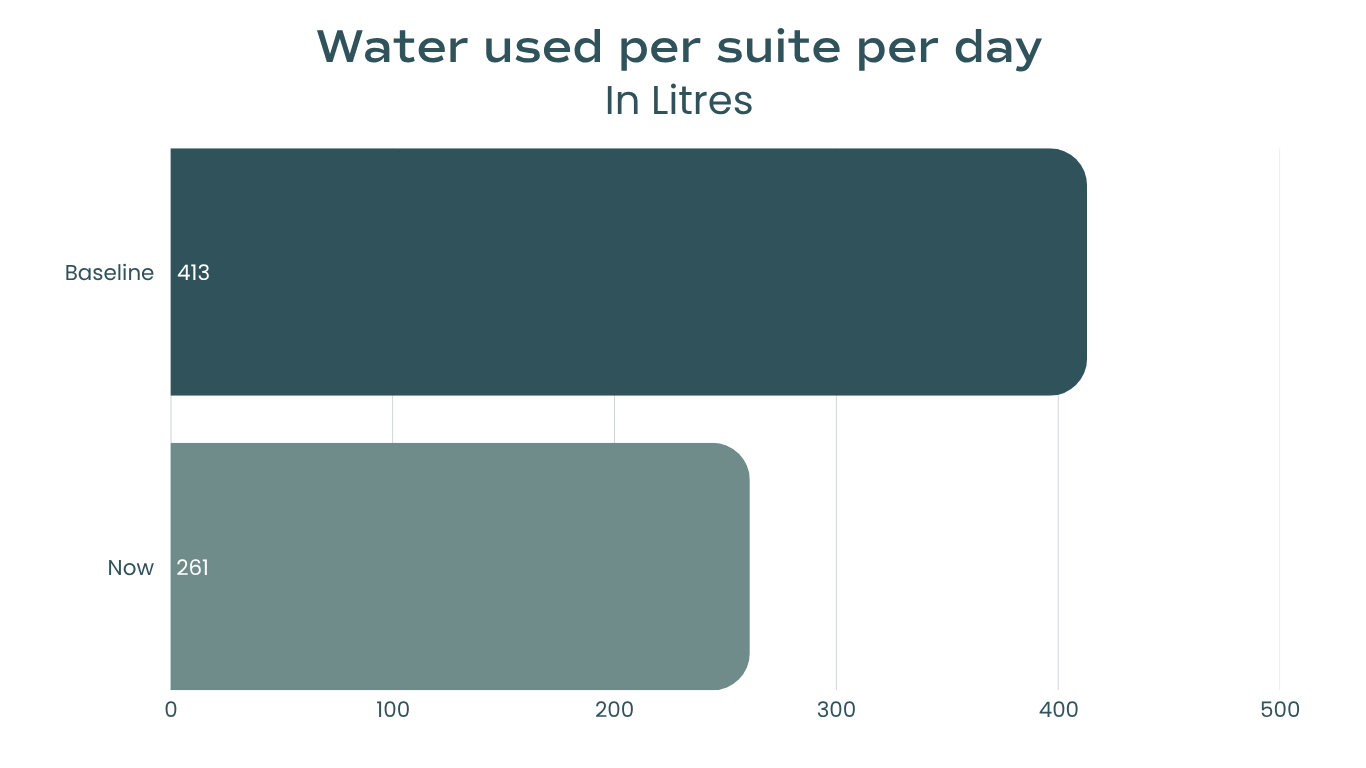
152 L less per suite, 83.7 m³ less per day across the property
THE PROJECT
Property: Neighbourhood - Rosedale East, Toronto. Two buildings, 275 units each, 550 suites.
Scope: In every suite, the existing toilets (a mix of 6 L and 4.8 L models) were replaced with 3.0 L Gerber Viper toilets, and new shower heads and bathroom and kitchen aerators were installed.
Completed: Building 1 on June 26, 2026. Building 2 on September 28, 2026.
Baseline: 227 m³ per day combined, which is 413 L per unit per day.
Structure: Shared Savings. Bondi assumed 100% of installation costs, so the owner committed no capital.
Measurement: AlertAQ hourly readings from the property’s compound meter, high and low registers combined into one total.
DAILY RESULTS
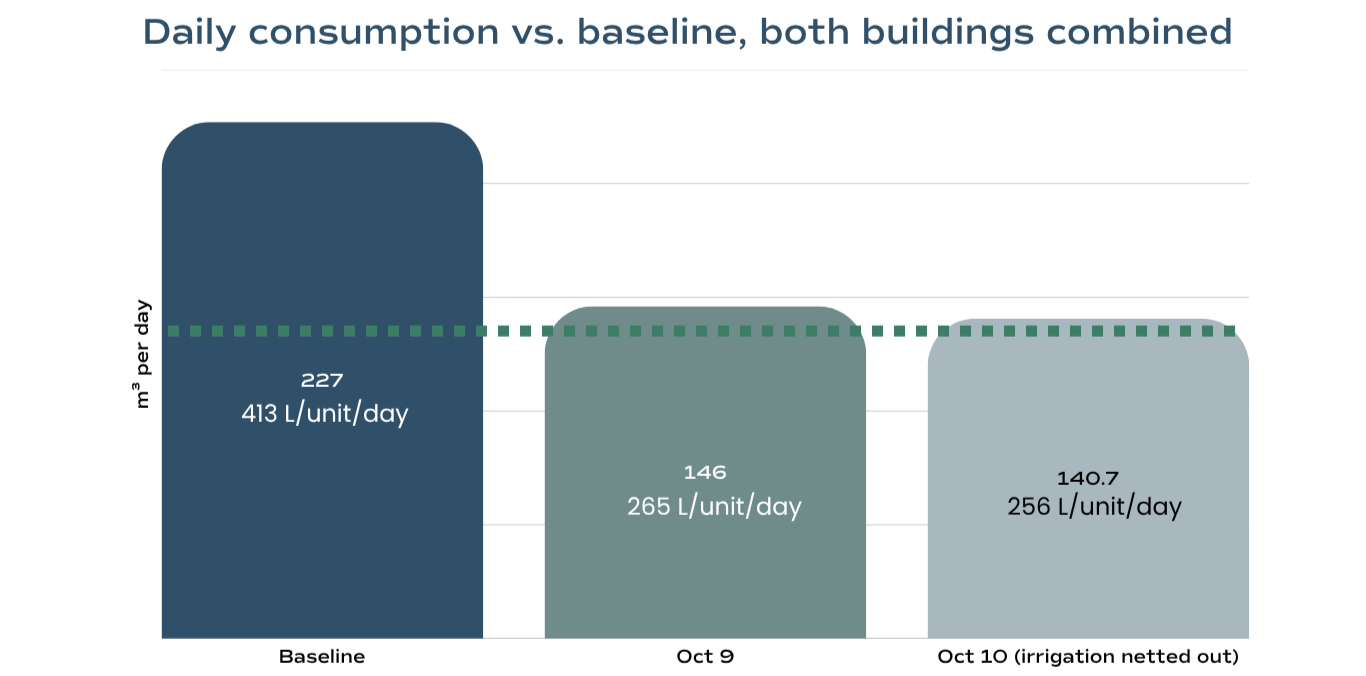
*2-day average 143.3 m³, 36.9% below baseline
Both full days after the second building was finished came in well under baseline: 146.0 m³ on October 9 (35.7% lower) and 140.7 m³ on October 10 (38.0% lower). The October 10 figure leaves out the 2 AM irrigation cycle, about 5.8 m³, so the comparison reflects suite water use only.
HOUR BY HOUR
Use follows a normal residential rhythm: a morning ramp from about 6 AM, a peak between 9 and 10 AM, a steady daytime plateau and a decline after 8 PM. The amber bar is the alternate-night irrigation cycle, which lands in the quiet overnight window and is removed from the savings calculation.
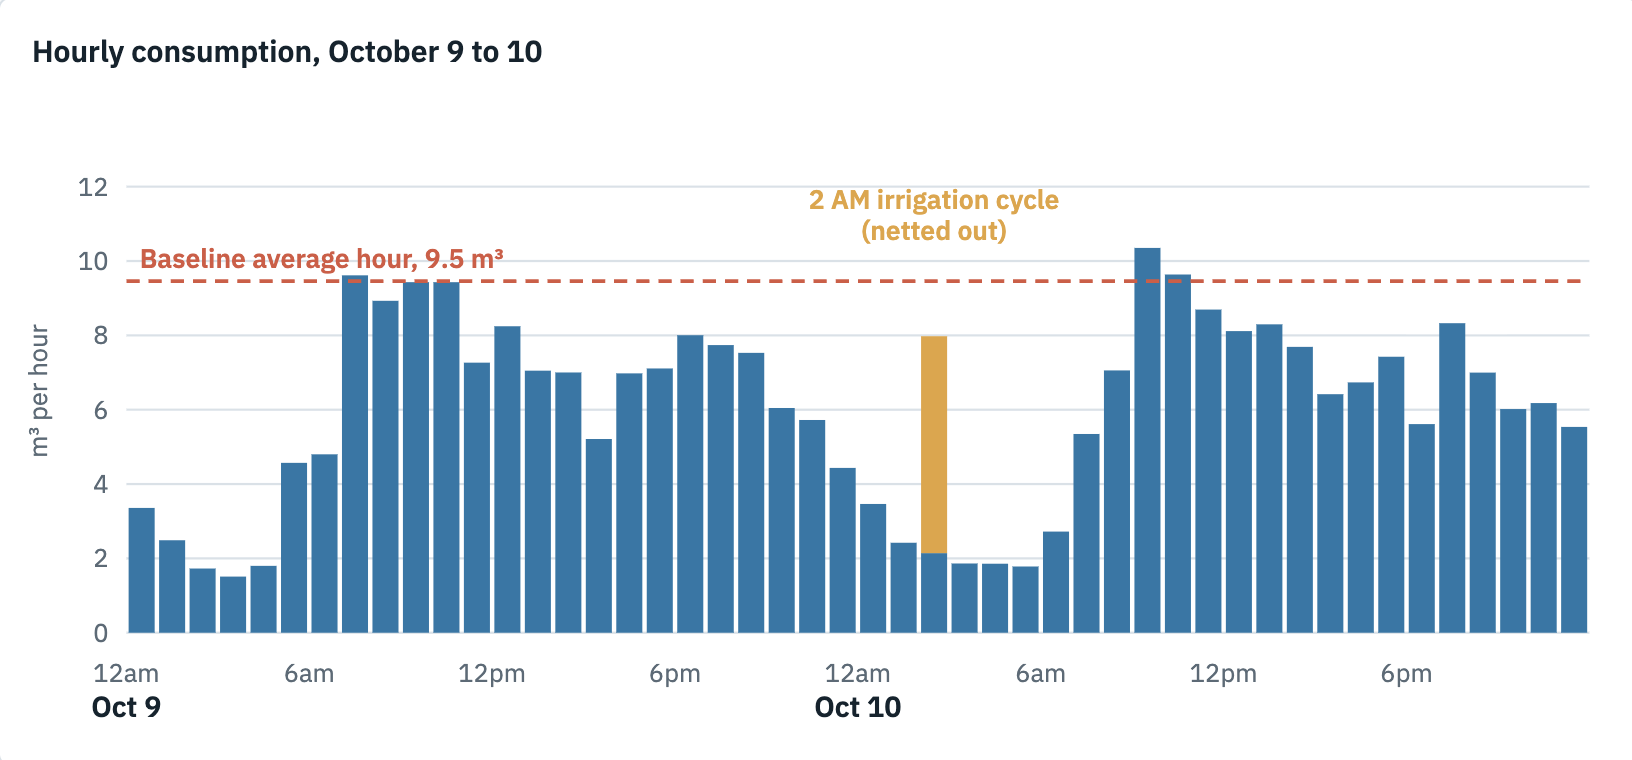
The baseline is a daily average, about 9.5 m³ per hour, not an hourly profile. A few peak hours can sit above that line while the full day still lands 37% below it, so the daily comparison is the like-for-like measure.
NO HIDDEN LOSSES OVERNIGHT
At 3 AM, the buildings draw 3.1 L per unit per hour on average (2.7 on October 9, 3.4 on October 10), under Bondi’s 5.0 benchmark. A low, steady night floor means the savings come from efficient fixtures, not from leaks hiding behind lower daytime use.
FINANCIAL IMPACT
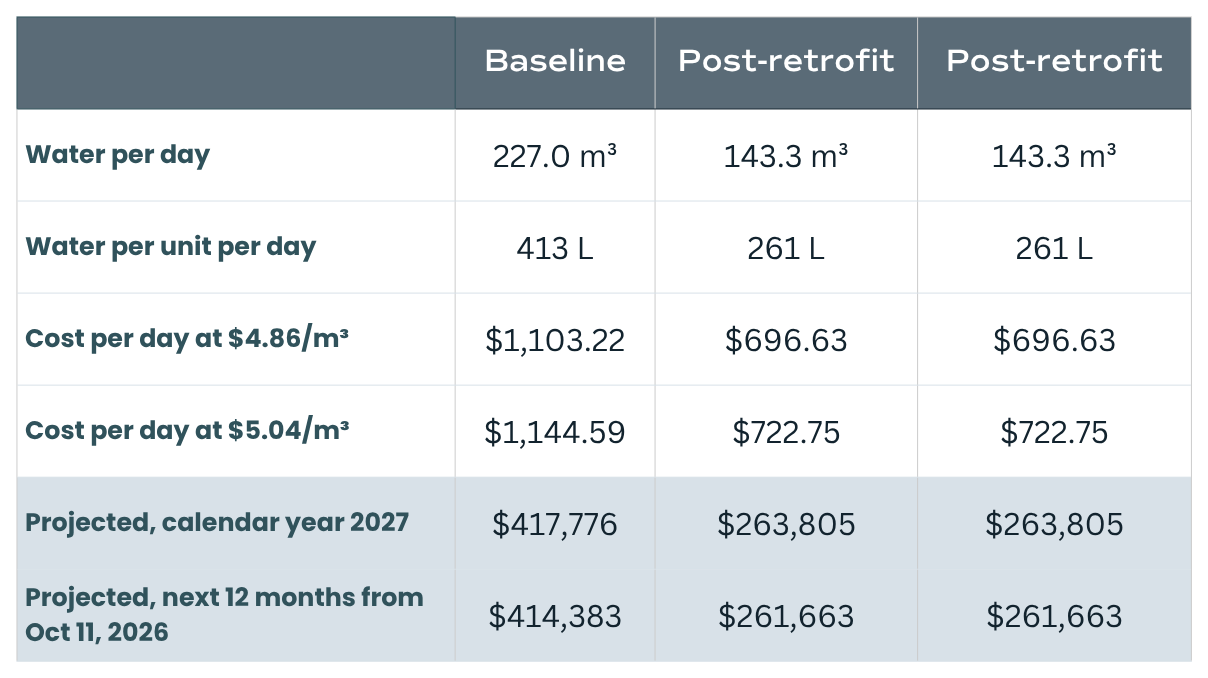
The water and sewer rate is $4.86 per m³ through December 31, 2026 and rises 3.75% to $5.04225 on January 1, 2027.
The next-12-months figure applies $4.86 for 82 days (October 11 to December 31) and $5.04225 for the remaining 283 days. Both projections assume current daily savings hold, about 30,500 m³ a year, and no further rate changes. They are projections, not measured results. Costs exclude taxes and fixed charges.
WHAT THIS MEANS
The savings are immediate. Within two weeks of Building 2’s completion, the data shows a 37% drop with a clean overnight floor.
The owner has no capital at risk. Bondi funded the fixtures and installation, and the owner benefits from lower water cost while savings are shared under the program.
Every suite is using 152 L less per day, 261 L against the 413 L baseline.
Irrigation is treated separately. It is netted out of the post-retrofit data. If the 227 m³/day baseline included irrigation, fixture-only savings would be slightly lower; the October 10 cycle was about 5.8 m³, roughly 2.5% of baseline.
METHOD

Data: AlertAQ hourly litres, October 9 00:00 to October 10 23:00 local time (48 readings). High and low registers are summed into one total.
Evaluation window: 48 hours following completion of both buildings. This is a preliminary read, to be refreshed on a trailing 7-day basis as more days are exported.
Baseline: 227 m³ per day for both buildings (550 units × 413 L per unit per day), as supplied.
Irrigation: the October 10 02:00 reading (8.0 m³) is replaced with the average of the adjacent hours (2.1 m³), removing about 5.8 m³. Irrigation runs on alternate nights, so October 9 had no cycle.
Rate: City of Toronto combined water and sewer, $4.86 per m³ through December 31, 2026, then $5.04225 from January 1, 2027.
